.png)


As multi-agent systems increasingly take center stage in modern AI infrastructure, the operational complexity of managing and debugging them continues to grow. Multi-step agent workflows, by design, execute a sequence of decisions and tool interactions, which are often asynchronous, branching, or recursive in nature. These agents operate with contextual memory, decision loops, retries, and intermediate state mutations. Traditional logging and monitoring approaches fail to provide the clarity needed to understand, trace, and debug these dynamic workflows effectively.
To address this, developers must embrace a comprehensive observability and logging architecture tailored specifically for agent-based systems. This involves structured, context-rich logs, distributed tracing for step-level visibility, semantic labeling for decision auditability, and metric pipelines to monitor behavior in production.
This blog explores how to implement production-grade observability and logging for multi-step agent workflows, with a focus on developer-centric techniques, architectures, and tools.
Multi-agent workflows are not strictly sequential. Agents can branch based on dynamic responses, invoke nested agents, retry failed steps, or even self-heal by choosing alternate paths. This non-linear execution model requires visibility beyond static call stacks. Developers need to trace how a query forks into sub-tasks, how long each sub-task took, and why a certain branch was taken over another. Conventional log aggregation cannot reconstruct such execution trees without trace-context propagation.
Many agent workflows maintain context across steps. This context includes the evolving prompt, user history, tool outputs, and retrieved data. State changes must be logged and observable at each step, otherwise developers are blind to how decisions evolve. Observability systems must support logging at each state mutation and provide a snapshot of memory context as it flows through the pipeline.
Agents often act as orchestration layers over tools such as vector databases, code execution environments, external APIs, or reasoning engines. A lack of visibility into tool performance, latency, and failures can create massive blind spots. Developers must log tool invocations with detailed metadata including input parameters, response payloads, duration, and error types to facilitate root-cause analysis and behavioral monitoring.
Agent workflows commonly include retry logic. If a tool fails or an output does not pass schema validation, agents will self-correct. These retries must be observable. Developers need to understand retry count, retry success rate, decision reasons, and differences between the original and retried inputs. Without such data, workflows become opaque and debugging becomes guesswork.
To make logs machine-parseable and semantically rich, structured logging is essential. Every log entry should be in JSON or protocol buffer format and include consistent fields such as agent_id, trace_id, step_name, tool_name, latency_ms, input_hash, output_summary, and error_type.
Structured logs allow downstream systems to query and filter logs based on high-dimensional data. They also enable temporal correlation, stepwise comparisons, and behavior classification. For instance, developers can filter all logs where the tool latency exceeds 2 seconds or where retries occurred within a specific step.
Distributed tracing allows developers to visualize how a request moves through each agent step and tool invocation. OpenTelemetry provides a vendor-neutral, language-agnostic way to implement tracing. Each agent action and sub-task should be wrapped in a span. Each span should include annotations for start time, end time, result size, success status, and parent-child relationship to other spans.
Using trace visualizers like Jaeger or Tempo, developers can explore waterfall diagrams showing precisely how a task unfolded. They can identify latency bottlenecks, retry cycles, and anomalous execution paths.
Developers should label each agent step semantically rather than generically. Instead of "step_3_completed", use labels like code_synthesis_python, api_schema_generation, or tool_result_validation. These semantic tags enable intent-level observability. Developers can then analyze the performance or failure patterns of specific step types across agents.
This tagging should be standardized in agent frameworks using enums or tag registries. It allows for deeper queries such as "find all agent runs where the retrieval step took more than 3 seconds" or "analyze failure distribution for embedding_vector_lookup steps".
To log system behavior without coupling it tightly with business logic, developers should use lifecycle hooks. Hooks should be triggered during:
These hooks allow developers to log structured data or emit metrics at key lifecycle events. For instance, in on_step_complete, a log can be emitted containing latency, token usage, memory state, and output payload hash. These hooks abstract away observability logic and make it reusable across agent variants.
Error logging should not be flat. Developers must categorize and tag errors based on failure class, such as:
Each error category should include detailed context, including stack traces, input-output snapshots, retry behavior, and downstream impact. This enables triage and statistical debugging at scale. Developers can track error heatmaps and determine which error classes need re-training, architectural changes, or tool replacements.
Metric instrumentation is essential for proactive monitoring and capacity planning. Developers should expose the following metrics via Prometheus or similar systems:
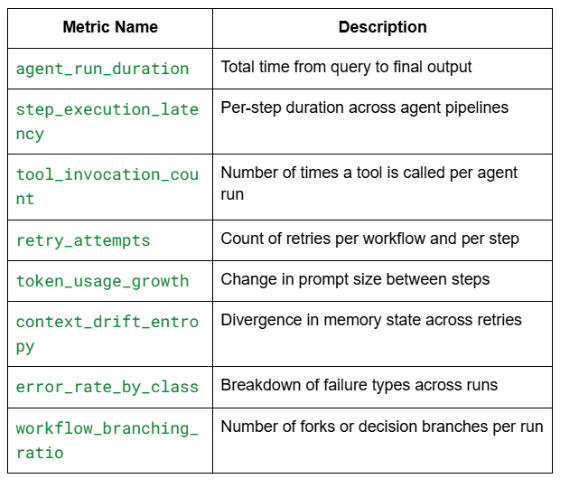
Metrics should be exported with labels such as agent_id, step_type, tool_name, and error_class to allow high-fidelity filtering and visualization in Grafana or similar dashboards.
A robust observability system for multi-step agents includes multiple layers:
Imagine a multi-step agent responsible for generating Python REST APIs. The user provides a high-level prompt:
"Create a Flask API with CRUD operations connected to Supabase and protected by JWT."
The agent’s workflow includes:
With observability in place:
Developers can visualize how often the schema generator tool fails for ambiguous input, track codegen latency over time, and determine how many retries lead to success. They can also analyze branching logic and inspect prompt drift after retries.
Observability and logging for multi-step agent workflows is not a luxury, it is an engineering necessity. As agent-based systems grow in complexity and scale, so does the need to understand their internals in a fine-grained, structured, and traceable way.
By combining structured logging, distributed tracing, semantic labeling, hook-based instrumentation, and telemetry pipelines, developers can gain deep insight into how agents behave across steps, tools, retries, and decisions. This observability foundation is crucial for debugging, scaling, compliance, optimization, and ultimately making autonomous systems production-ready.
Without observability, agents remain opaque black boxes. With observability, they become measurable, auditable, and reliable components of modern software systems.


.png)


