.png)


AI-based code optimizers have been gaining attention for their ability to rewrite, refactor, and improve application logic with little to no human intervention. But the key question remains, are these optimizations actually improving runtime performance, memory efficiency, and system throughput, or are they simply making the code syntactically cleaner? This blog is aimed at developers and software engineers who want to understand how to technically and precisely measure real performance gains achieved through AI-driven code optimization tools. We will walk through the process of defining metrics, setting up rigorous benchmarks, profiling applications, and analyzing results in a way that is both statistically sound and practically useful in production environments.
AI-based code optimizers refer to tools or systems that utilize artificial intelligence, typically large language models or agentic systems, to automatically rewrite, refactor, or restructure code in a way that improves some aspect of its performance, readability, or maintainability. These tools are becoming part of the modern developer toolkit and are increasingly integrated into code editors, CI/CD pipelines, and agent-driven IDEs.
Examples of such tools include:
These systems are often capable of recognizing inefficient patterns such as redundant computations, suboptimal data structures, and poorly utilized concurrency models, and can recommend or directly rewrite those sections with more performant alternatives.
Many developers encounter AI-generated code suggestions that appear to be improvements at first glance. These often include smaller code blocks, fewer lines, or use of advanced libraries. However, this visual or structural refactor does not always equate to runtime efficiency.
For instance, replacing a list comprehension in Python with a NumPy operation might result in better performance for numerical arrays, but if your project does not already depend on NumPy, you might incur significant memory overhead and longer cold-start times. Similarly, using asynchronous code could reduce blocking, but if used improperly, it could lead to event loop saturation and worse latency under load.
This is why it is critical to measure performance not by aesthetics, but by quantitative metrics.
The first step in evaluating AI-based code optimizers is to define what “performance gain” means in your specific context. Without clear performance key performance indicators (KPIs), any improvement will be subjective and unmeasurable.
This is the most common KPI. It refers to the amount of time it takes for a piece of code or a system to complete a task. It is especially important in CPU-bound and real-time systems.
Throughput is defined as the number of operations or transactions the system can handle per unit time. This is critical for backend systems, data pipelines, and any scenario involving high concurrent traffic.
Memory consumption can be a bottleneck in systems running in constrained environments like edge devices, mobile phones, or containers with limited resources. Any optimization that reduces memory allocation, garbage collection overhead, or heap growth is considered beneficial.
In systems involving parallel computing, AI inference, or high-frequency trading, the utilization of cores or GPU resources is crucial. Efficient use of vectorized instructions, SIMD, or CUDA calls often leads to significant performance gains.
At the lower level, optimizations that reduce instruction count, cache misses, or improve branch prediction significantly impact CPU-bound tasks. These are measured using advanced profiling tools like perf, Intel VTune, or hardware counters.
For mobile apps and IoT devices, battery usage and energy consumption are increasingly important. Optimizations that reduce CPU wake-ups, avoid background polling, or eliminate inefficient loops help preserve battery life.
Each application may require a different combination of the above KPIs, and the performance gains should be reported in those specific dimensions rather than general metrics like “code is faster”.
Once KPIs are defined, the next step is to isolate the candidate code for testing and create repeatable benchmark harnesses. This ensures that the before and after code changes can be tested in a controlled and deterministic environment.
To properly measure the effect of an AI-driven optimization, isolate the optimized block from the rest of the codebase. This eliminates noise from unrelated functions and ensures repeatable results.
For example, if optimizing a JSON parsing function, create a micro-benchmark that calls only that function on a known dataset. Avoid including logging, file I/O, or external dependencies.
Random input generation should be avoided unless you seed the random generator consistently across test runs. You must also warm up the execution environment if using JIT languages, such as Java or JavaScript, to allow the optimizer to settle.
Depending on the language, use the following tools:
Always run each benchmark for multiple iterations, ideally with 30 or more warm and hot runs, and report confidence intervals in addition to means.
With a stable benchmark harness in place, run tests on the original and AI-optimized versions of the code. Collect quantitative metrics and analyze them across the KPIs defined earlier.
Do not rely solely on average execution time. Report standard deviation, min and max values, and 95th percentile values. This is especially important for latency-sensitive applications where tail latencies impact user experience.
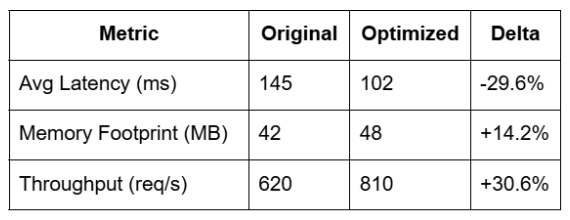
Prepare a side-by-side comparison that highlights not only improvements but also regressions. Some optimizations might improve execution time but increase memory usage or introduce new dependencies. Capture all relevant metrics to inform downstream decisions.
Example comparison:
Micro-benchmarks are necessary but insufficient. Real gains emerge only when the code is executed within the full application stack under realistic load.
Simulate traffic using tools like:
Run these under load balancers or inside Kubernetes environments to capture true performance under concurrency.
Use system profilers to collect flamegraphs and hot path execution traces:
Flamegraphs help identify whether the AI-optimized function actually receives more CPU time or reduces total cycles spent in computation.
You should also examine the impact of optimized code on:
AI-based optimizations may reduce CPU time but increase blocking or memory pressure in other parts of the system.
Apart from runtime metrics, optimized code should be evaluated for structural and maintainability improvements. Use static analysis tools to measure these changes.
Tools like radon (Python), ESLint complexity plugin (JavaScript), and SonarQube (Java) can report cyclomatic complexity, function length, nesting depth, and duplicated branches.
Measure how many additional packages or native modules the optimization introduces. Additional dependencies could lead to bloat or security vulnerabilities.
For frontend apps and WebAssembly code, track bundle sizes using webpack-bundle-analyzer, esbuild, or similar tools. Optimized code should not increase production payloads unnecessarily.
Point-in-time benchmarking is helpful, but true performance engineering requires continuous integration of measurement into your dev cycle.
Add benchmark scripts to CI pipelines using:
Set thresholds for acceptable variance. If a PR increases average latency by more than 5 percent, or adds 10 MB of memory usage, automatically flag it. Combine this with feature flags to roll out optimized modules gradually.
Let us walk through a practical example.
def preprocess(img_path):
from PIL import Image
img = Image.open(img_path).resize((224, 224)).convert("RGB")
return np.array(img)
import cv2
def preprocess(img_path):
img = cv2.imread(img_path)
img = cv2.resize(img, (224, 224))
img = cv2.cvtColor(img, cv2.COLOR_BGR2RGB)
return img
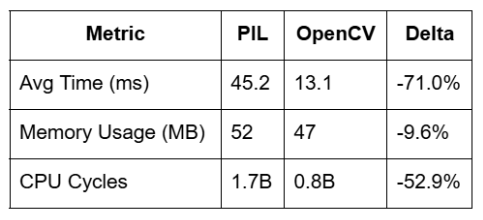
This is an example of a measurable and impactful gain using an AI-optimized alternative, where the change also introduced fewer allocations and improved CPU efficiency.
Measuring performance gains from AI-based code optimizers is a technically involved, multi-step process that cannot be reduced to surface-level assumptions. Developers must apply rigorous measurement techniques, create controlled environments, and integrate benchmarking into CI workflows.
If you are looking to integrate AI-based code optimization into your workflow with a focus on performance metrics, modular builds, and full-stack coverage, explore GoCodeo. It is an agentic AI coding platform that helps you not only generate but also measure and validate optimizations at every step.


.png)


